 DE
DE  EN
EN 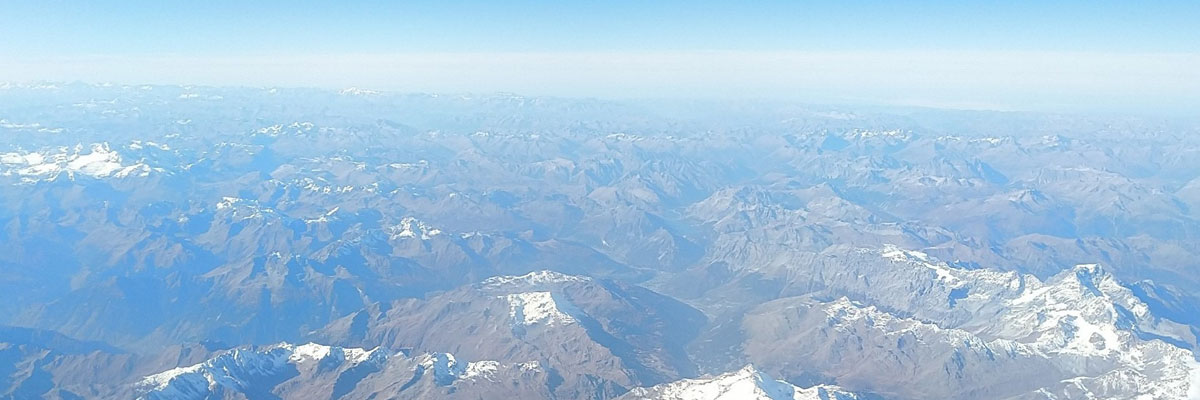
Watch the video below to find out more: “The Atmosphere: The Invisible Ocean Above Us”

The relationship between altitude, pressure, density and temperature
Air pressure and temperature are closely linked to altitude above sea level. As altitude increases, air pressure decreases and temperature generally drops as well.
These fundamental relationships determine the structure of the atmosphere and strongly influence weather and climate.
This page explains:
- how air pressure is created
- why air pressure decreases with altitude
- why temperature decreases in the troposphere
- the role of water vapour
- and how these processes interact
How is air pressure created?
Air pressure is created by the weight of the column of air above the Earth’s surface. Gravity pulls the air masses toward the Earth, resulting in a higher air density near the ground than at greater altitudes.
Thought experiment
If the atmosphere were not pulled toward the Earth by gravity, the gases would be evenly distributed in space and would have the same pressure and temperature everywhere. This corresponds to the left-hand air column. In reality, however, all gases are pulled toward the Earth by the gravitational force acting on them (right-hand air column).
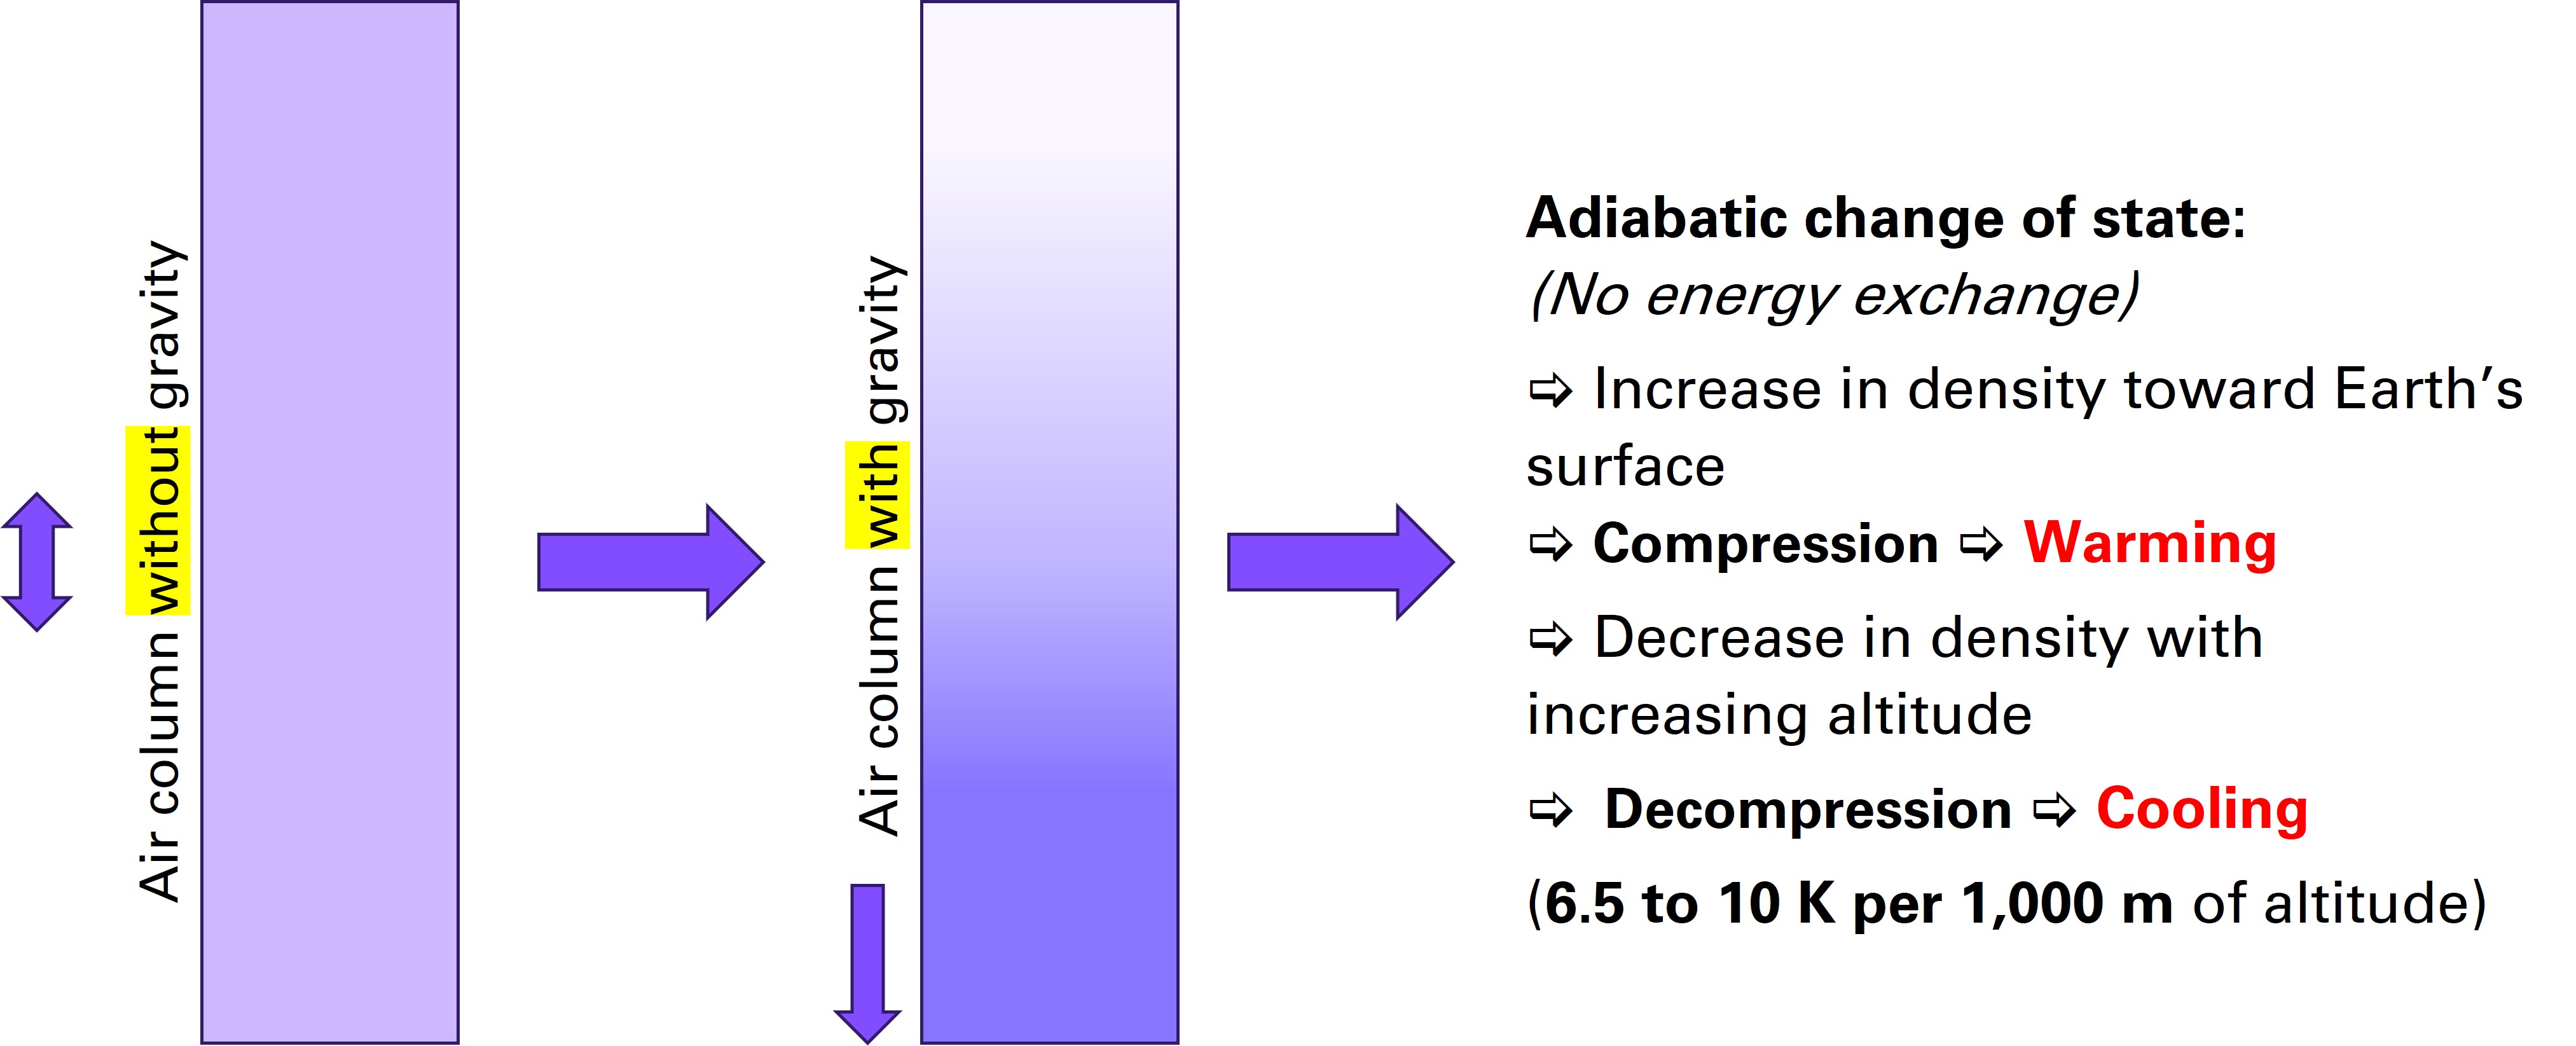
Effect of Gravity
(© Brugger 2023)
Conclusion:
The gases in the air create air pressure through the sum of their respective weights (the sum of their partial pressures). In everyday life, we usually do not consciously perceive this pressure.
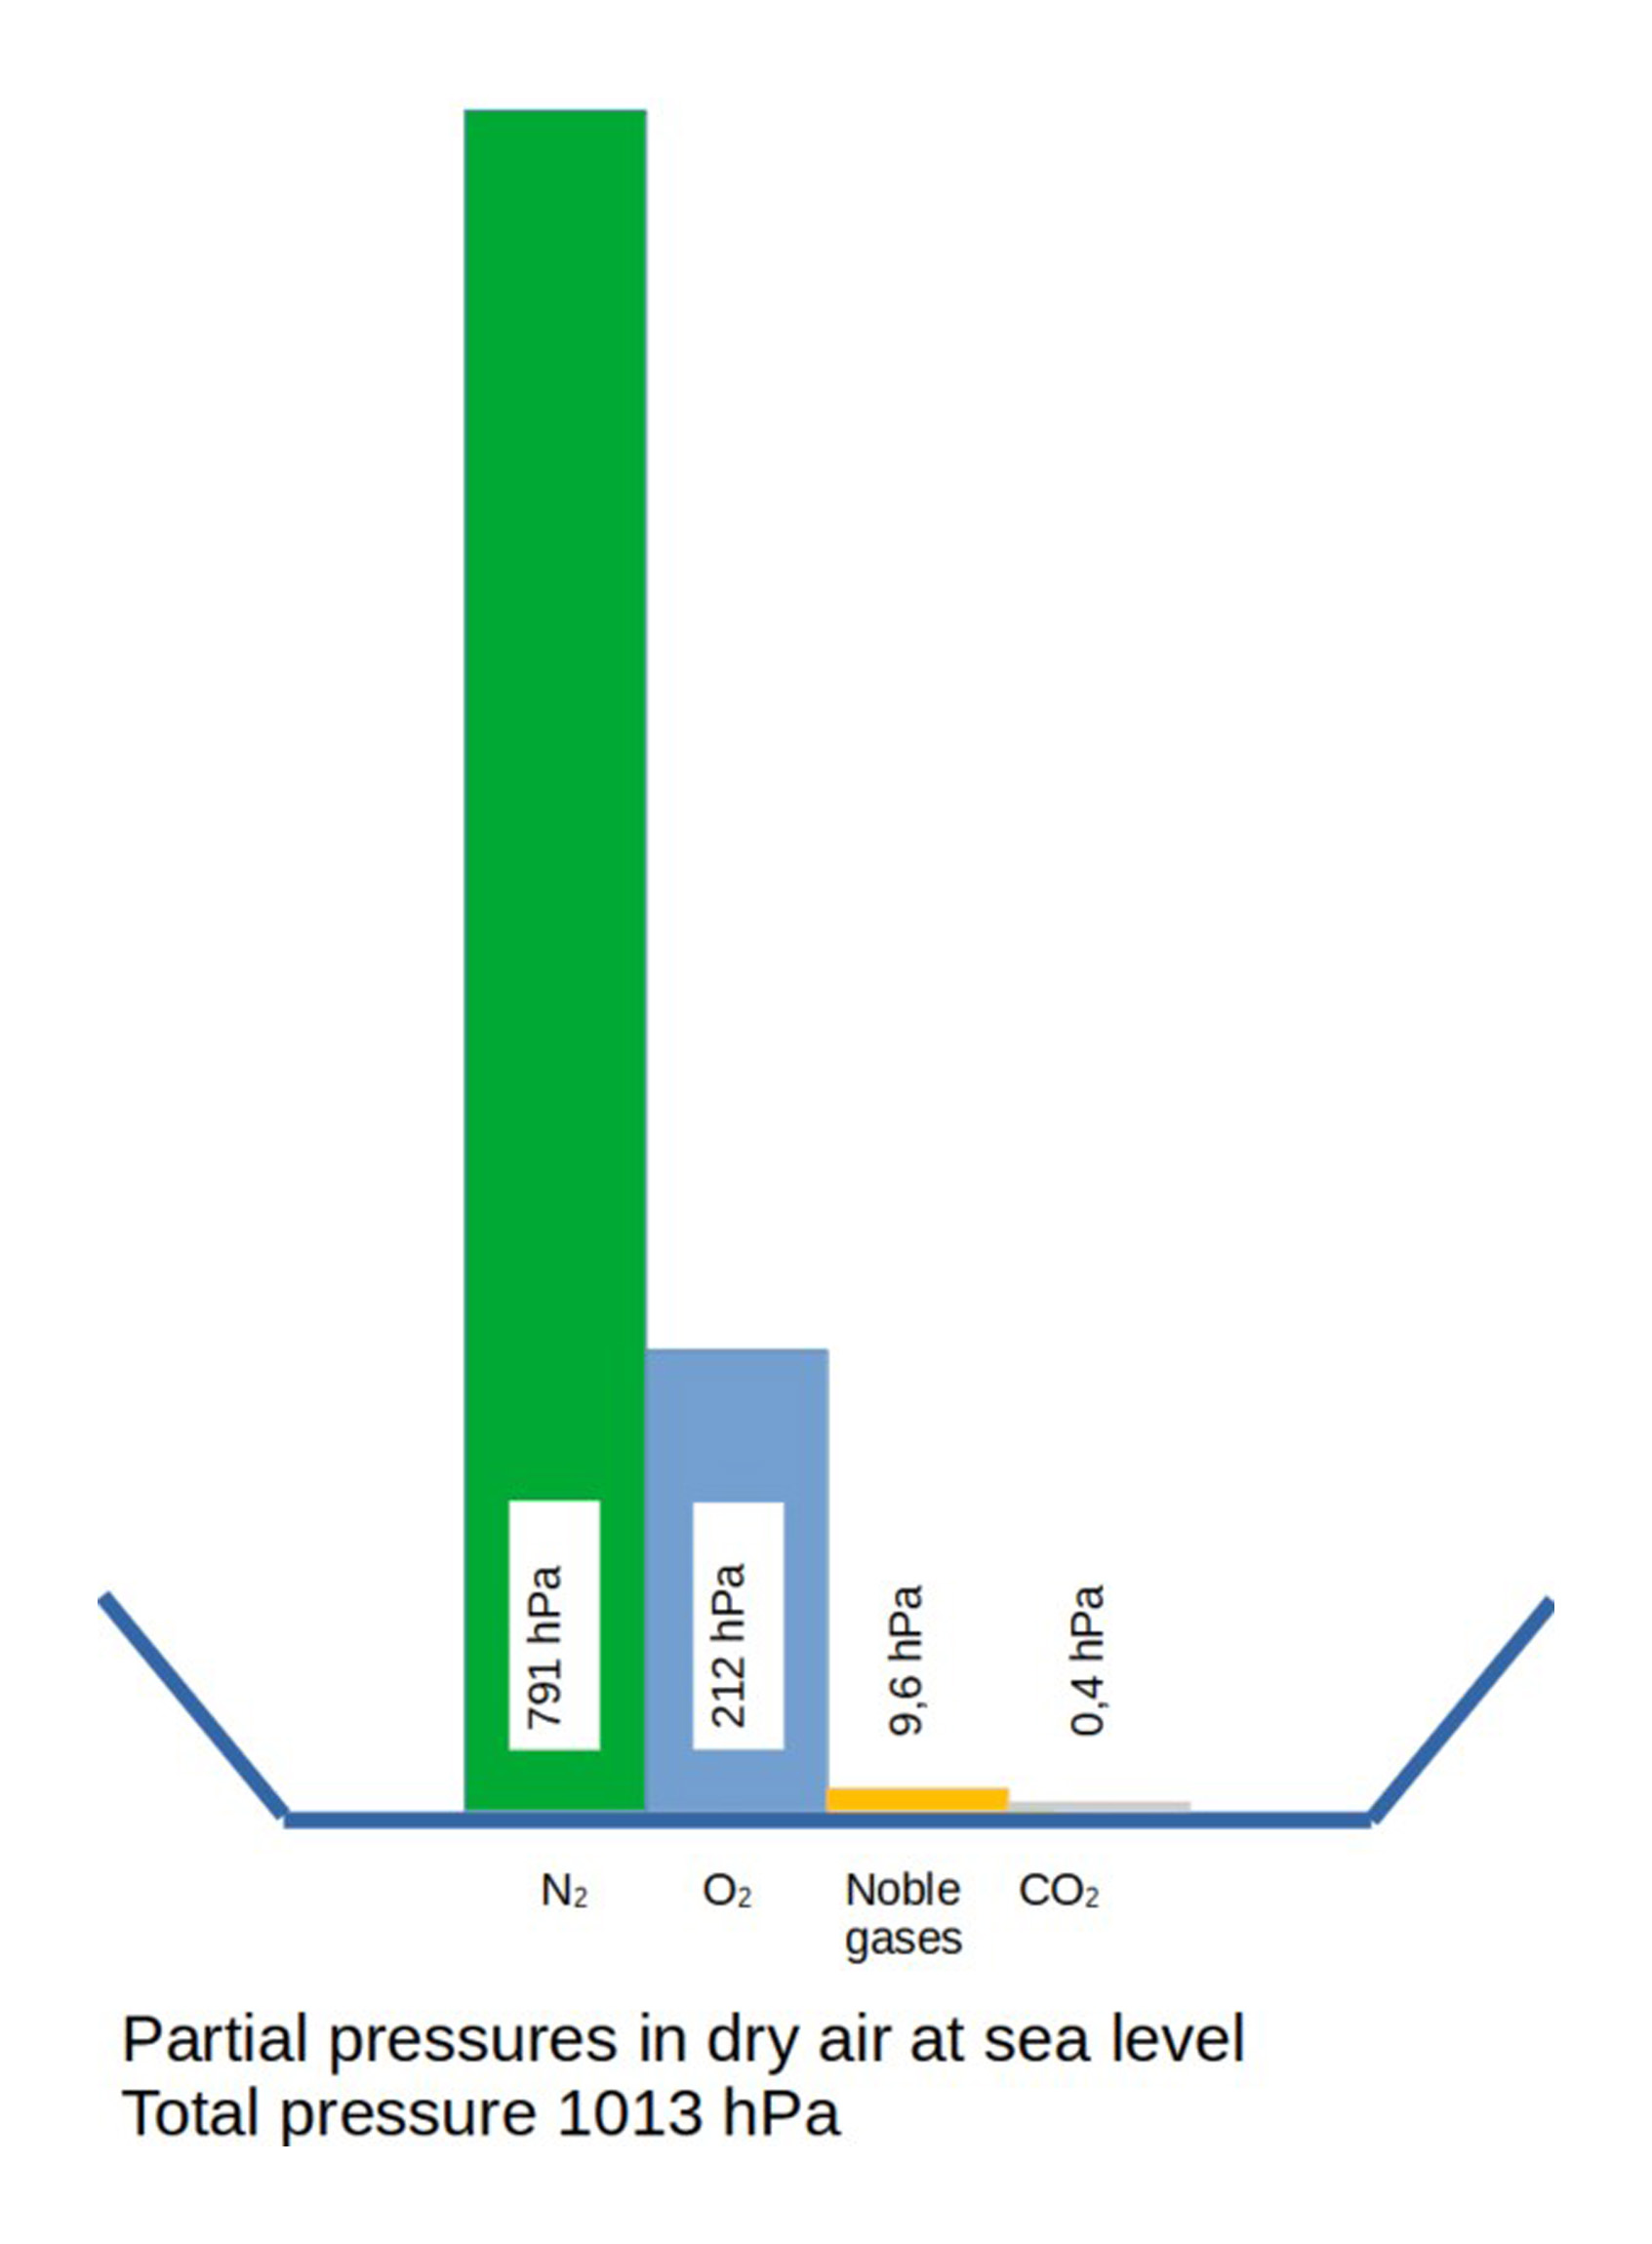
Proportion of gases in atmospheric pressure
(© Brugger 2023)
At sea level, the average air pressure is p₀ = 1,013 hPa (hectopascal).
This corresponds approximately to:
- a load of about 10 tonnes per square metre
- or a water column about 10 metres high
The atmosphere is held together by gravity and pulled toward the Earth’s surface. As altitude increases, air density decreases and air pressure falls.
Why does air pressure decrease with altitude?
As altitude increases, the mass of air above decreases. As a result, pressure falls continuously. This relationship is described by the barometric formula for altitude. Air pressure does not decrease linearly, but exponentially.
Examples:
0 m → 1013 hPa
5,500 m → approx. 500 hPa
10,000 m → approx. 290 hPa
This means that about half of the total air mass is already located below approximately 5,500 metres. The troposphere, where weather takes place, contains about 85% of the total air mass as well as nearly all atmospheric water vapour.
Excursion into mathematics – for those who want a more precise explanation
The relationship between altitude and air pressure is described by the barometric altitude formula.
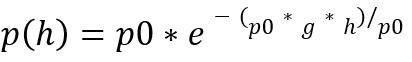
By applying this formula, the corresponding air pressure can be calculated and graphically displayed for any altitude. In the following graph, water vapour is not taken into account because, unlike the other gases, its proportion varies greatly in space and time.
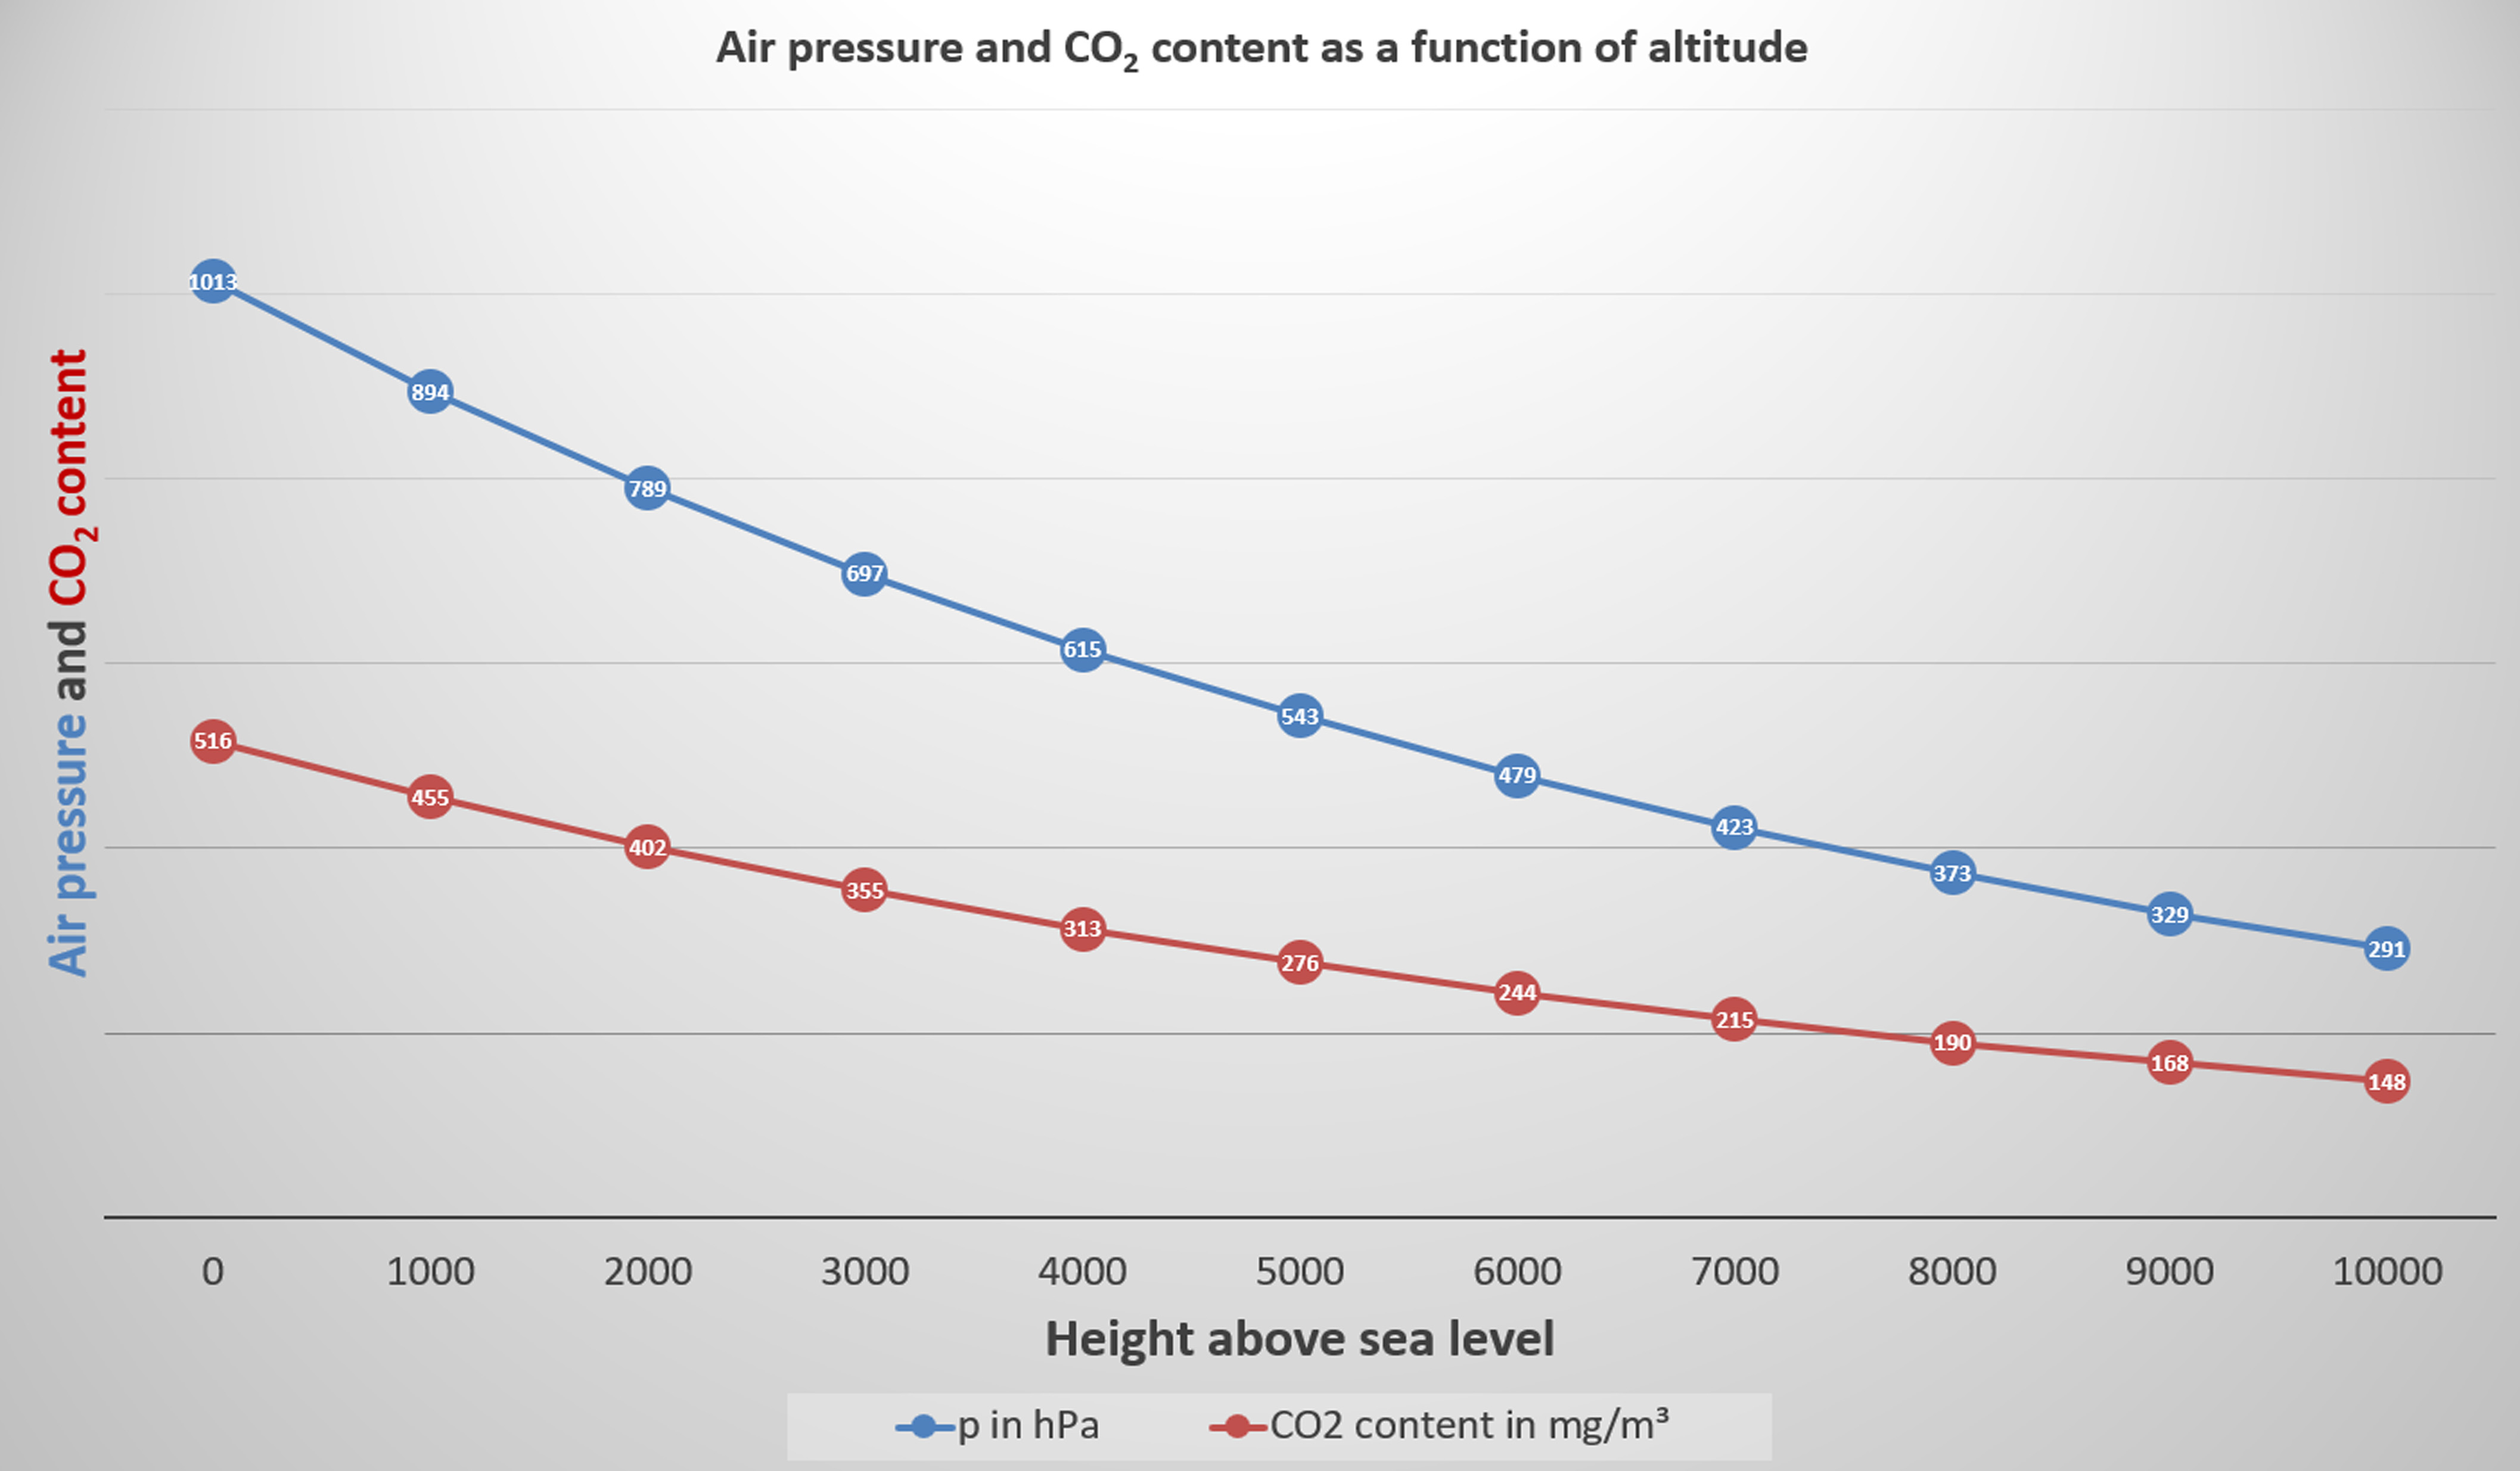
Air pressure and CO2-Content as a function of altitude
(© Brugger 2023)
Why does temperature decrease with altitude?
As altitude increases, not only does air pressure decrease, but temperature also falls. This is mainly due to the decreasing air density (the number of energetically excited particles decreases).
When air rises, it expands because of the lower surrounding pressure. In doing so, it performs work and cools down. This process takes place without heat exchange with the surroundings and is referred to as adiabatic cooling.
Typical temperature decrease:
dry air: about 9.8 °C per 1000 m
moist air: about 5–7 °C per 1000 m
The lower rate of cooling in moist air results from the latent heat stored in water vapour.
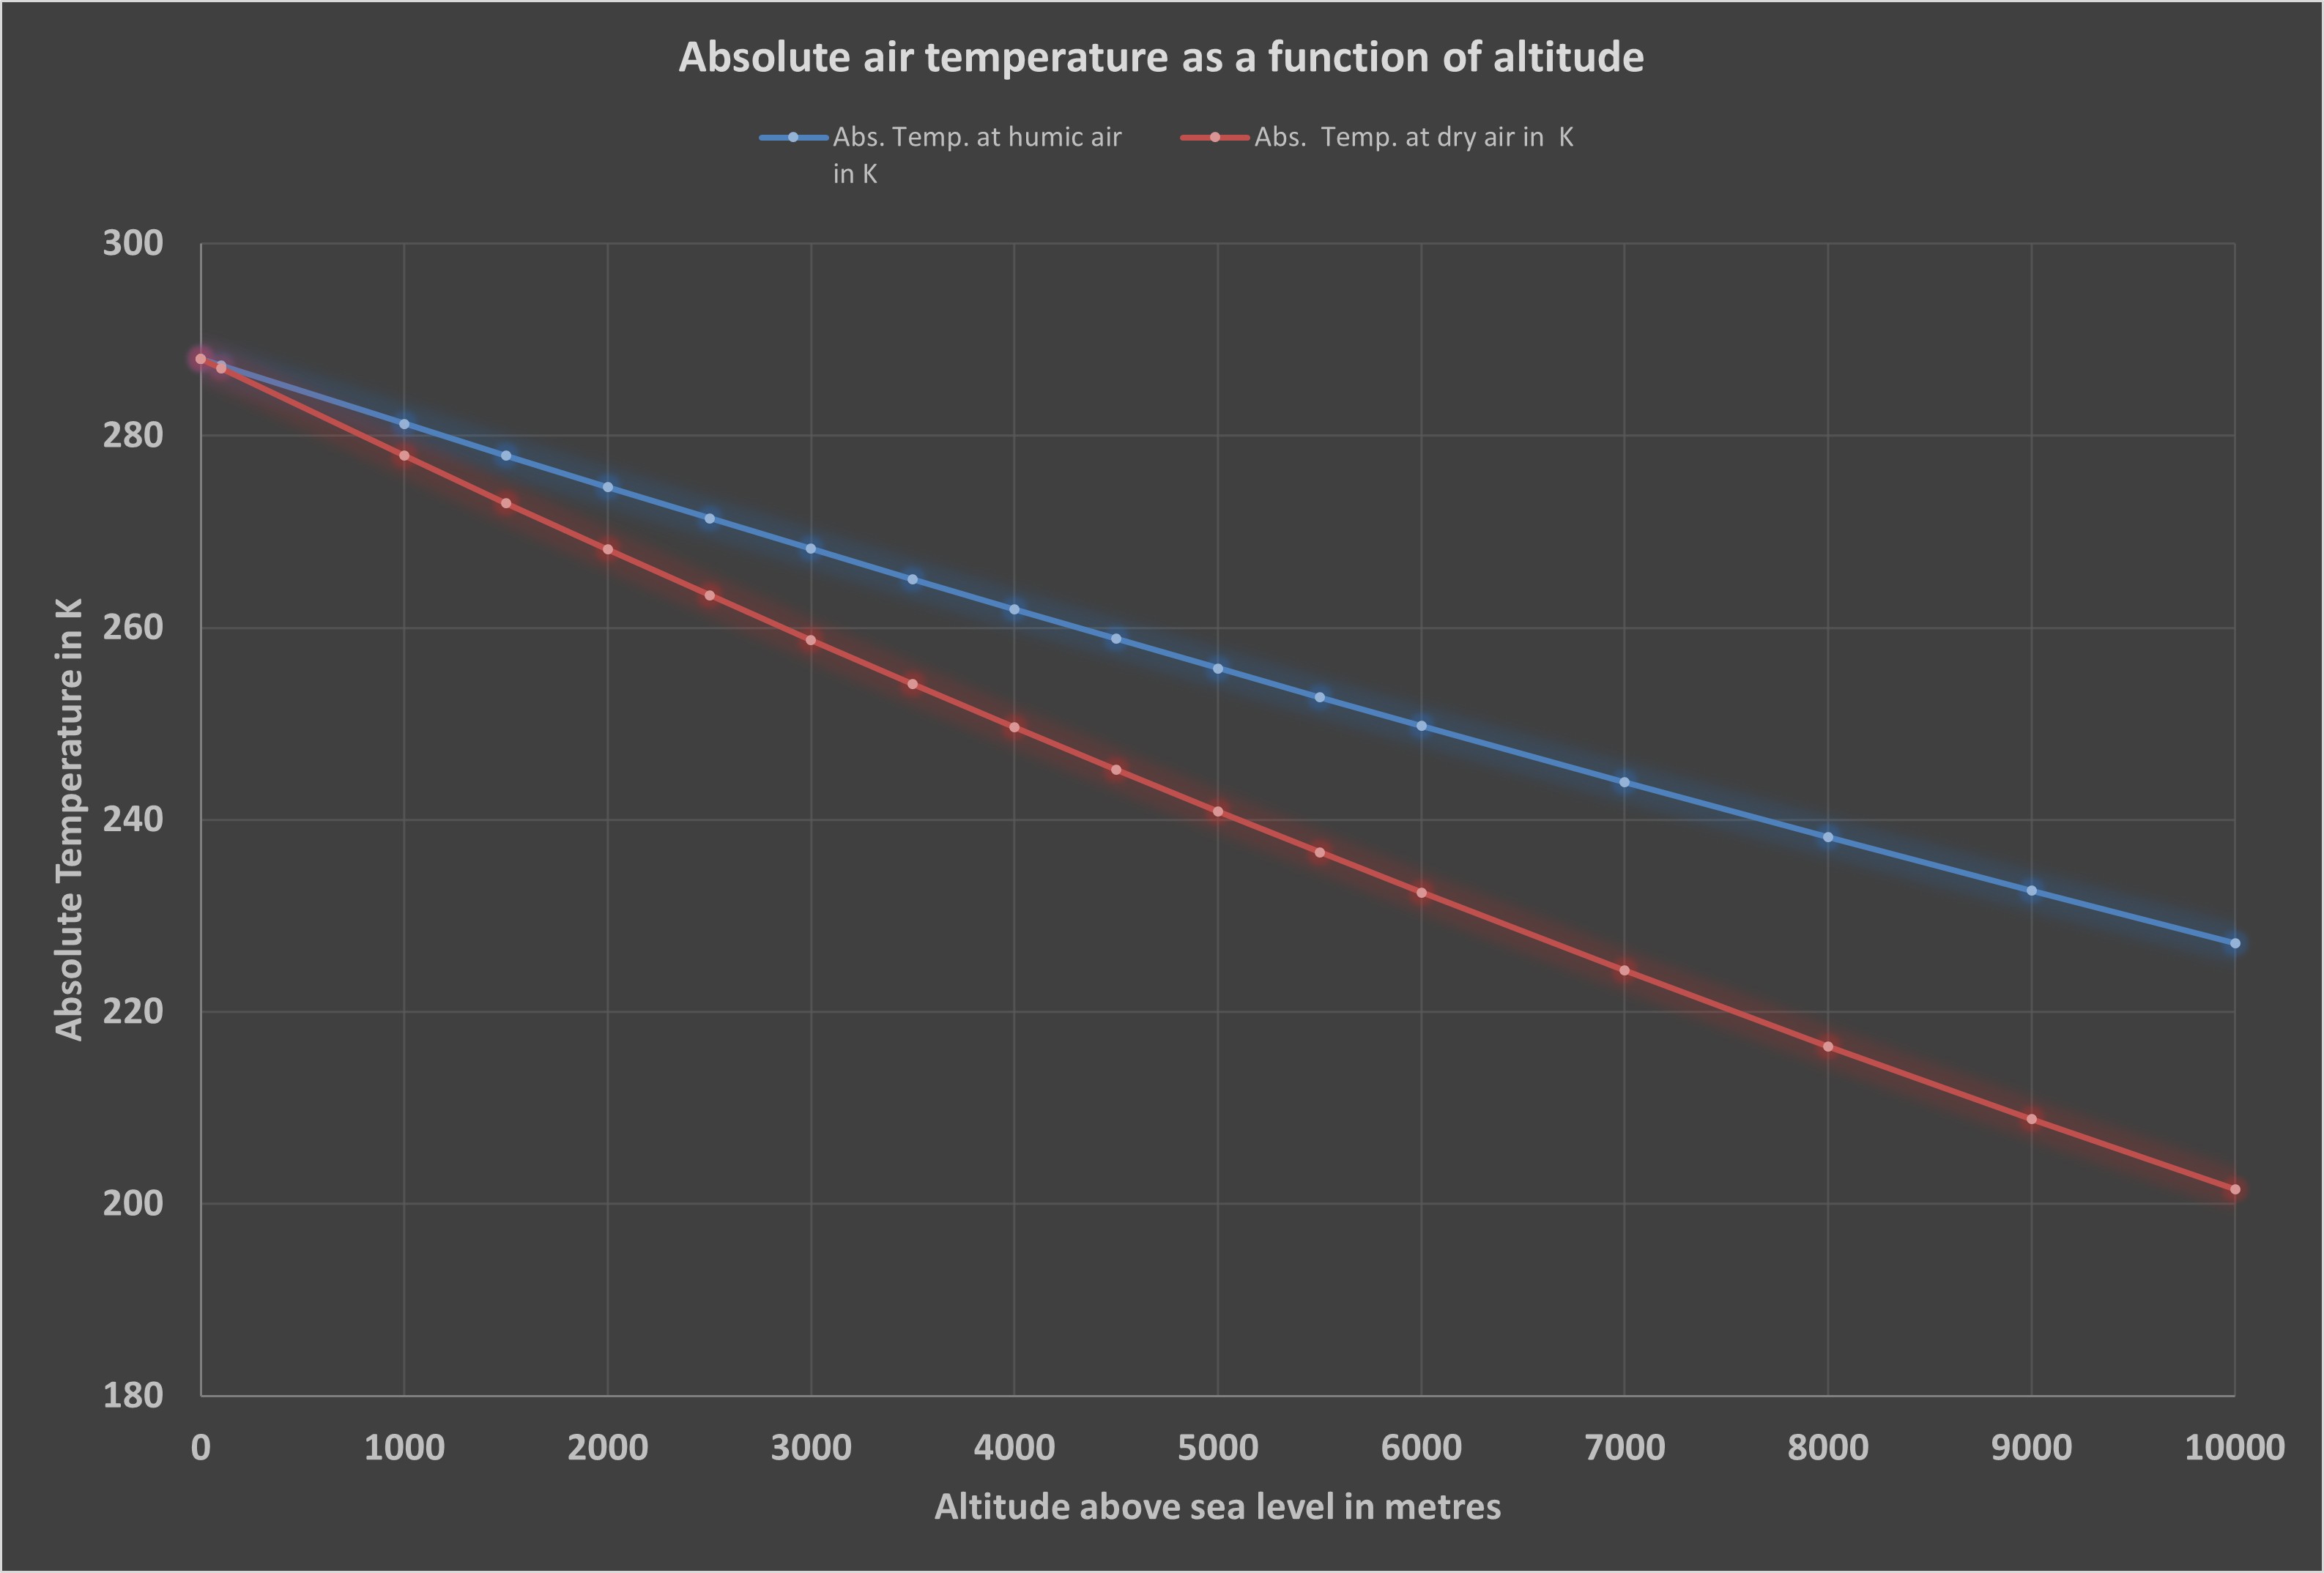
Air temperature as a function of altitude
(© Brugger 2023)
The strong influence of water vapour is clearly shown in the diagram.
Excursion into reality – for those who want a more precise explanation
The fact that the theoretical calculations for normally humid air agree well with real measurements is shown by the values displayed by the onboard system during an approach for landing at Frankfurt Airport. The ground temperature was about 5–8 K higher than the 15 °C (288 K) on which the blue curve is based. At altitudes above 10,000 m, the measured temperatures indicate significantly drier air.
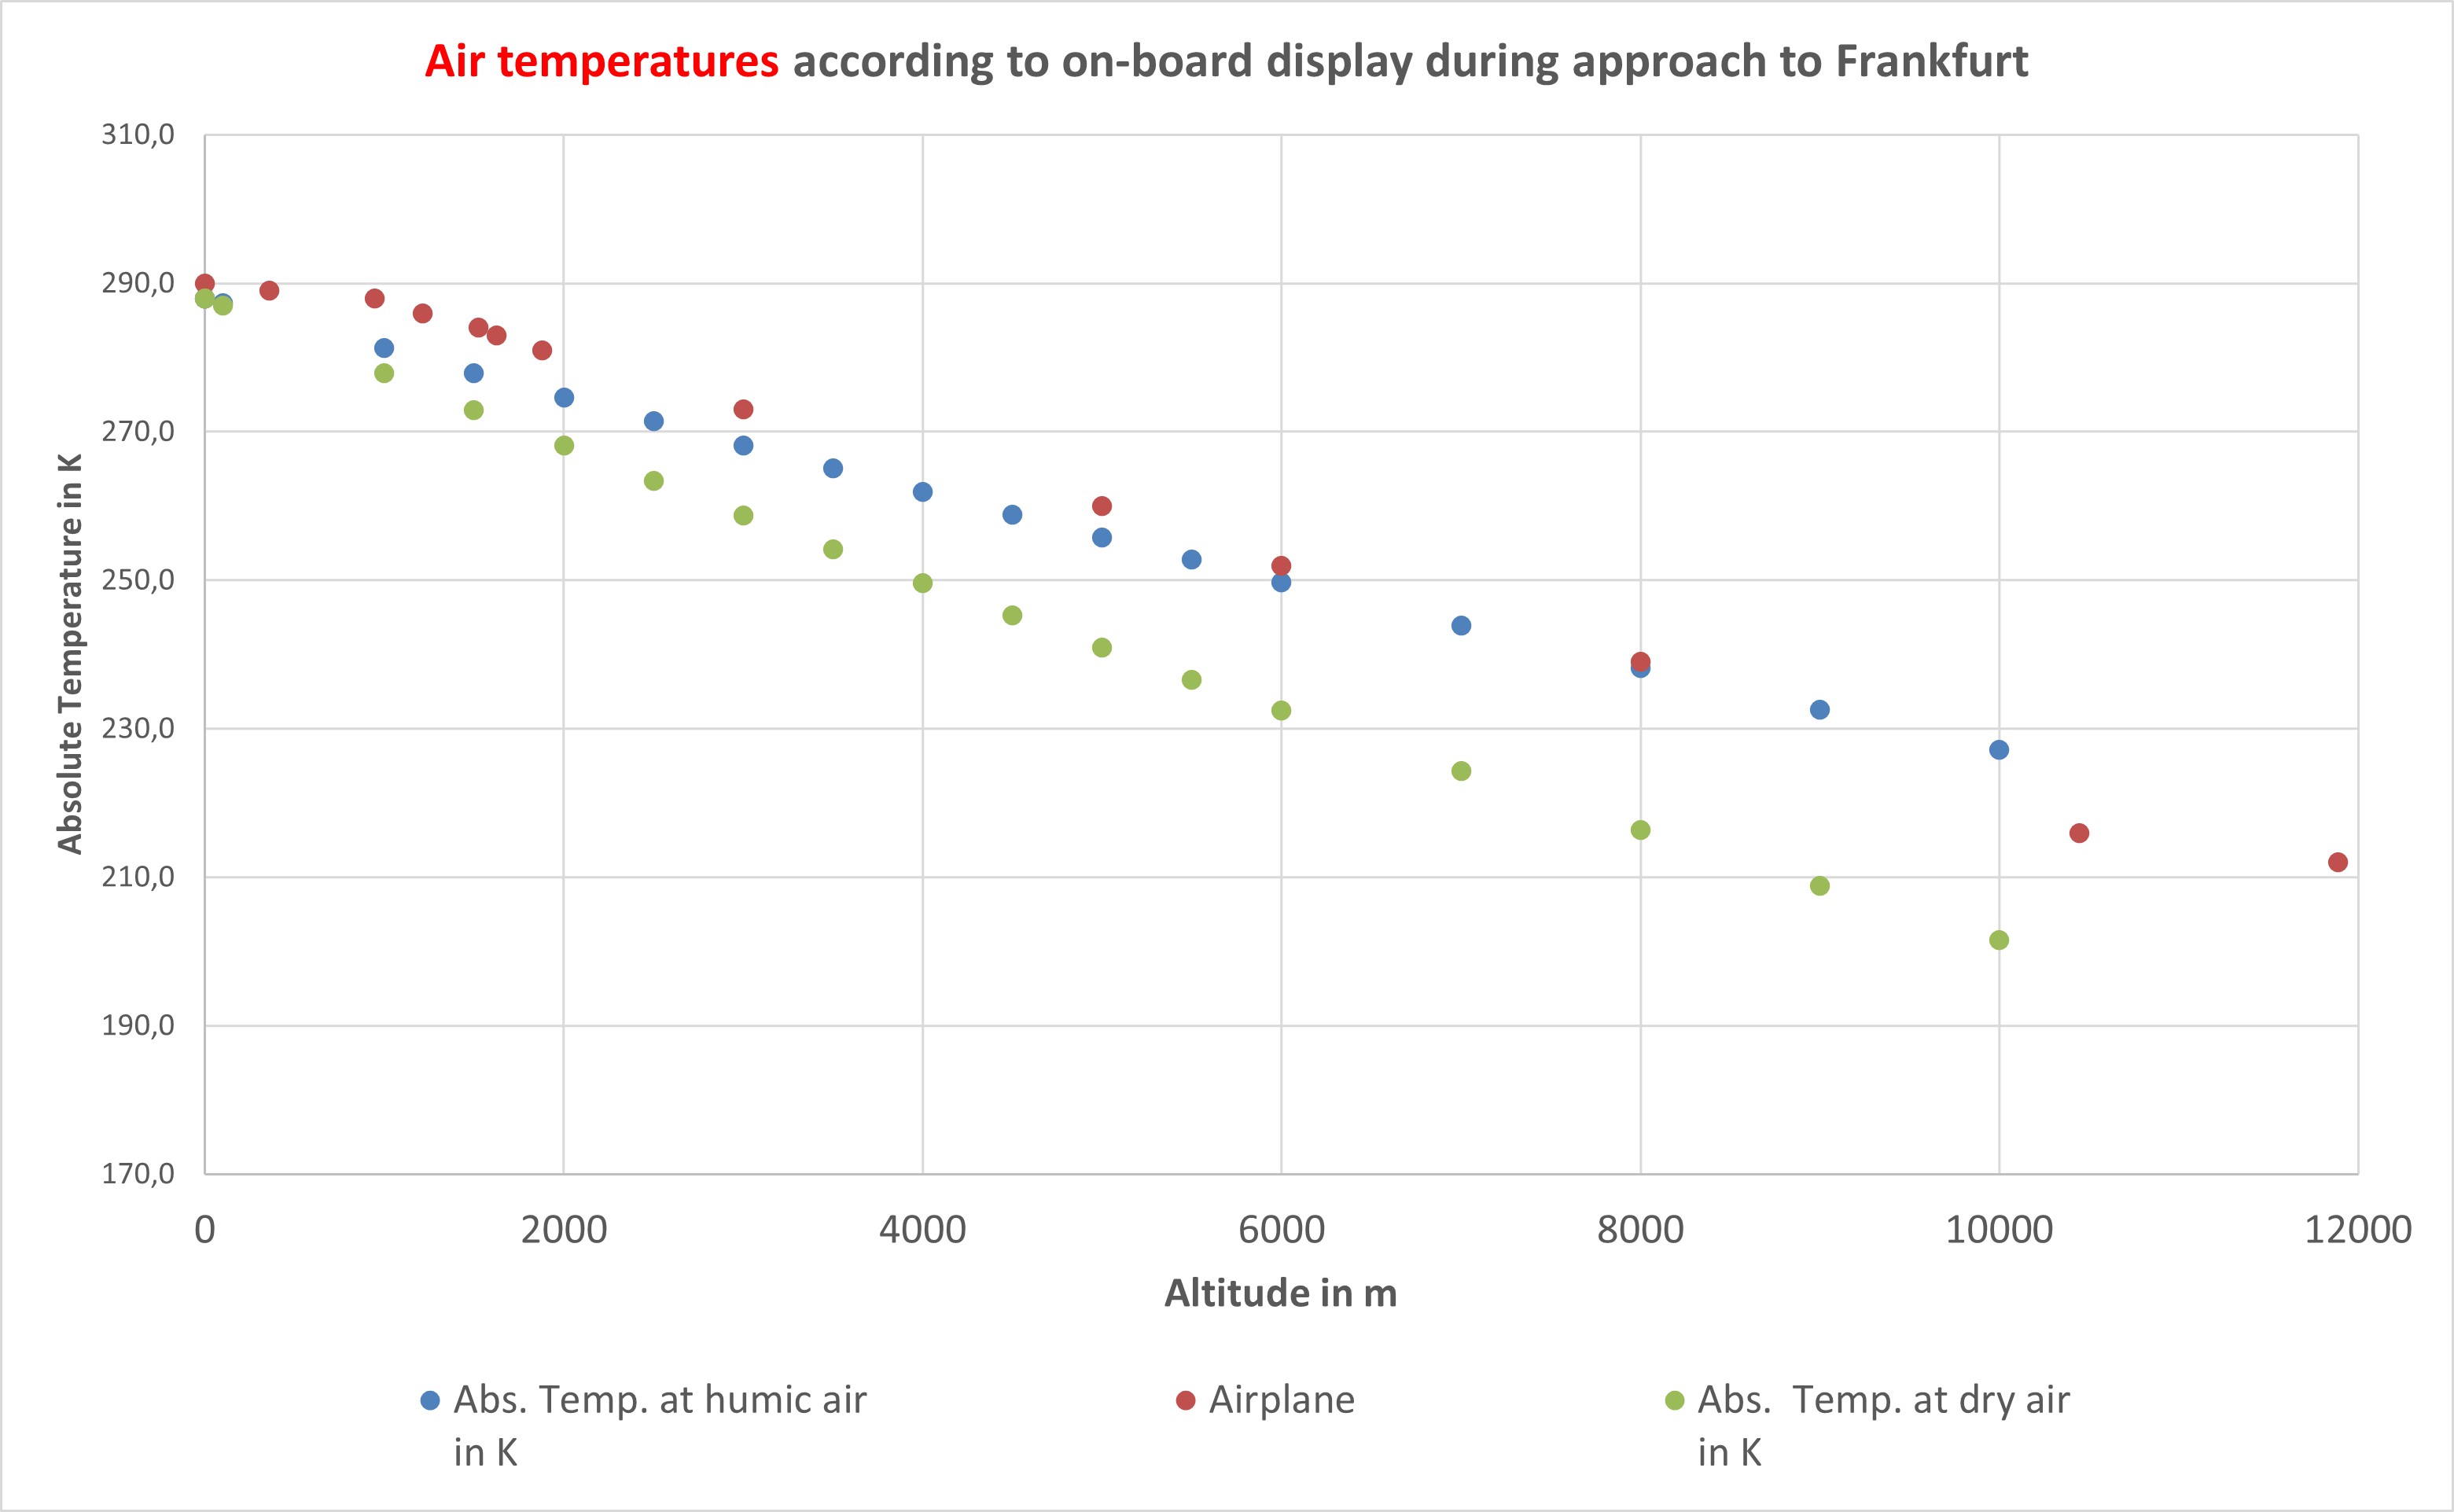
Air temperature as a function of altitude
(© Brugger 2025)
Note:
The data and tables on which the diagrams are based are available directly for download. For air temperature, two curves were calculated: one for dry air (red line) with the isentropic exponent i = 0.286, and one for normally humid air (blue line) with i = 0.19. In the second case, the water vapour previously not taken into account is included.
Temperature profile of the troposphere
The average temperature decreases with altitude in the troposphere.
Typical values:
Surface: +15 °C (global average)
5 km: about −15 °C
Tropopause: about −55 to −80 °C
The tropopause marks the transition to the stratosphere. In the stratosphere, temperature rises again, mainly due to the absorption of UV radiation by ozone.
Air pressure, temperature and atmosphere – the interaction
Air pressure, temperature and altitude are closely linked physically:
- As altitude increases, air pressure decreases
- Falling pressure leads to the expansion of air
- Expansion causes cooling
- Water vapour changes the temperature gradient
- These processes determine the structure of the atmosphere
The temperature distribution in the troposphere thus results from the combination of:
- gravity
- air pressure
- change in density
- adiabatic processes
- water vapour
Conclusion
The relationship between air pressure and temperature is a physical property of atmospheric gases. The decrease in air pressure with altitude leads to the expansion of the air mass and therefore to cooling. And vice versa.
Together with the influence of water vapour, this creates the typical temperature profile of the troposphere. These physical processes determine weather, cloud formation, and shape the energy balance of the atmosphere.
Understanding these relationships helps to better classify the dynamics of the atmosphere and climatic processes.
Further topics
- Atmosphere
- The global water cycle explained
- Solar energy
- Wind and Weather
- Wind energy
- Greenhouse - Yes or No?
- The book about wind power and climate